Understanding Promtail and Loki (Part-6)
Today, I want to explain two important tools we commonly use in log management: Promtail and Loki.
Part-1: https://brillertechnologies.blogspot.com/2025/11/prometheus-and-grafana-projectpart-1-by.html
Part 2: https://brillertechnologies.blogspot.com/2025/11/monitoring-containers-with-cadvisorpart.html
Part 3: https://brillertechnologies.blogspot.com/2025/12/understanding-prometheus-in-simple-way.html
Part 4: https://brillertechnologies.blogspot.com/2025/12/understanding-prometheusmonitoring-made.html
Part 5: https://brillertechnologies.blogspot.com/2025/12/grafana-setup-dashboard-creation-part-5.html
What is Promtail?
Promtail is a tool that scrapes or collects logs from your system.
For example, it can read logs from the folder /var/log on your EC2 instance.
What is Loki?
Loki is basically a log database or data source.
When Promtail collects logs, it forwards those logs to Loki, and Loki stores them.
How do we actually see the logs?
To visualize the logs, we connect Loki with Grafana.
Grafana reads the logs from Loki and then we can build dashboards to view and analyze them.
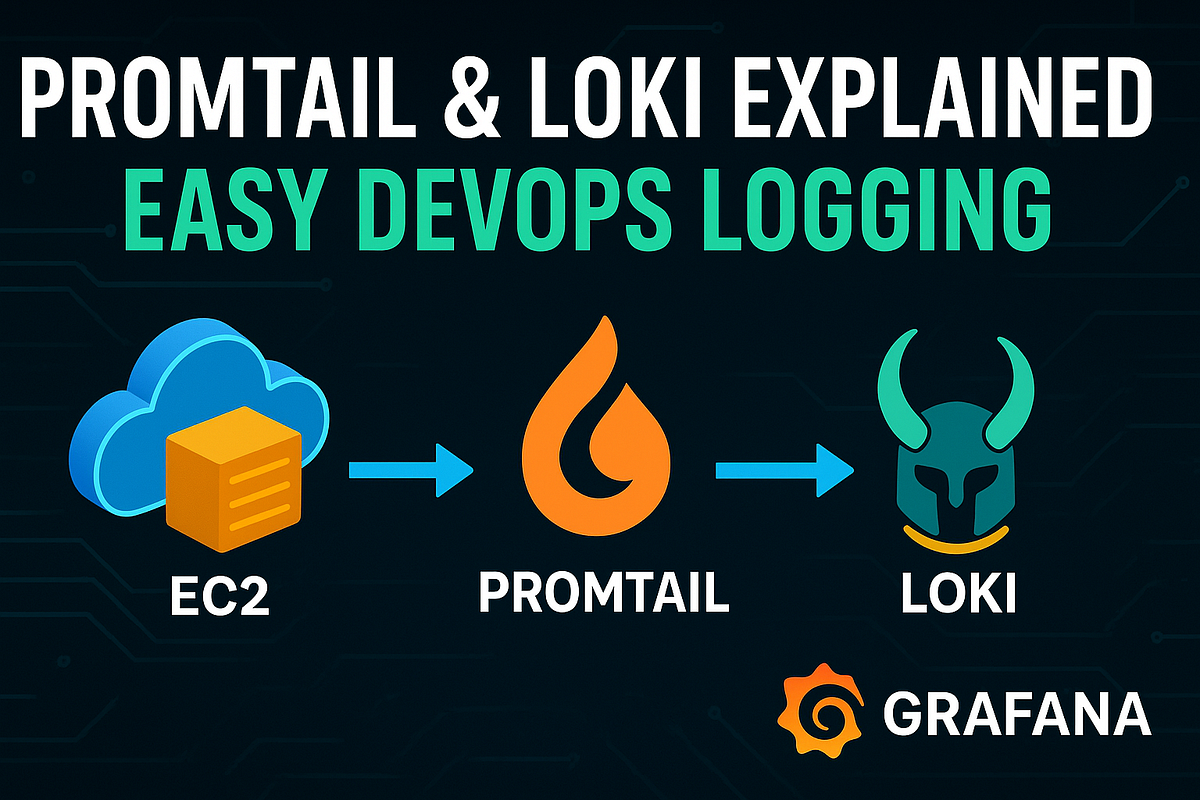
Complete Flow of Log Collection
EC2 → Promtail → Loki → GrafanaThis is the full hierarchy of how logs move from your server all the way to your dashboard.
Configuration Example
Loki
loki:
  image: grafana/loki:latest
  ports:
    - "3100:3100"
  volumes:
    - ./loki-config.yml:/etc/loki/loki-config.yaml
Promtail
promtail:
  image: grafana/promtail:latest
  volumes:
    - ./promtail-config.yml:/etc/promtail/promtail-config.yaml
In Simple Words
- Promtail = Log Scraper (collects logs)
- Loki = Log Database (stores logs)
This combination makes it easy to collect, store, and visualize your logs in Grafana.


Comments
Post a Comment