📘 Understanding Prometheus in a Simple Way-Part 3 (For DevOps Beginners)
In our previous blogs, we have already covered:
- How to launch an EC2 instance (Link: https://medium.com/@raeesyaqubqazi/prometheus-and-grafana-project-part-1-by-raees-yaqoob-qazi-12eb5c431350)
- How to run our Notes App inside a Docker container (Link: https://medium.com/@raeesyaqubqazi/prometheus-and-grafana-project-part-1-by-raees-yaqoob-qazi-12eb5c431350)
- How to install cAdvisor to collect container-level metrics (Link:https://medium.com/@raeesyaqubqazi/monitoring-containers-with-cadvisor-part-2-of-my-previous-blog-series-cec2452b1ba5)
Today, we will move one step ahead and learn Prometheus, which will collect the metrics generated by cAdvisor.
🔍 What Is Prometheus?
Before understanding Prometheus, let’s talk about how data is stored in databases.
✔️ Relational Databases (MySQL, PostgreSQL)
Data is stored in rows and columns — like an Excel sheet.
✔️ Prometheus (TSDB — Time Series Database)
Prometheus does NOT store data in tables.
It stores data in Time Series format.
⏱️ What is Time Series Data? (TSDB Explained in Simple Words)
Time Series means:
Data that changes with time and is stored along with timestamps.
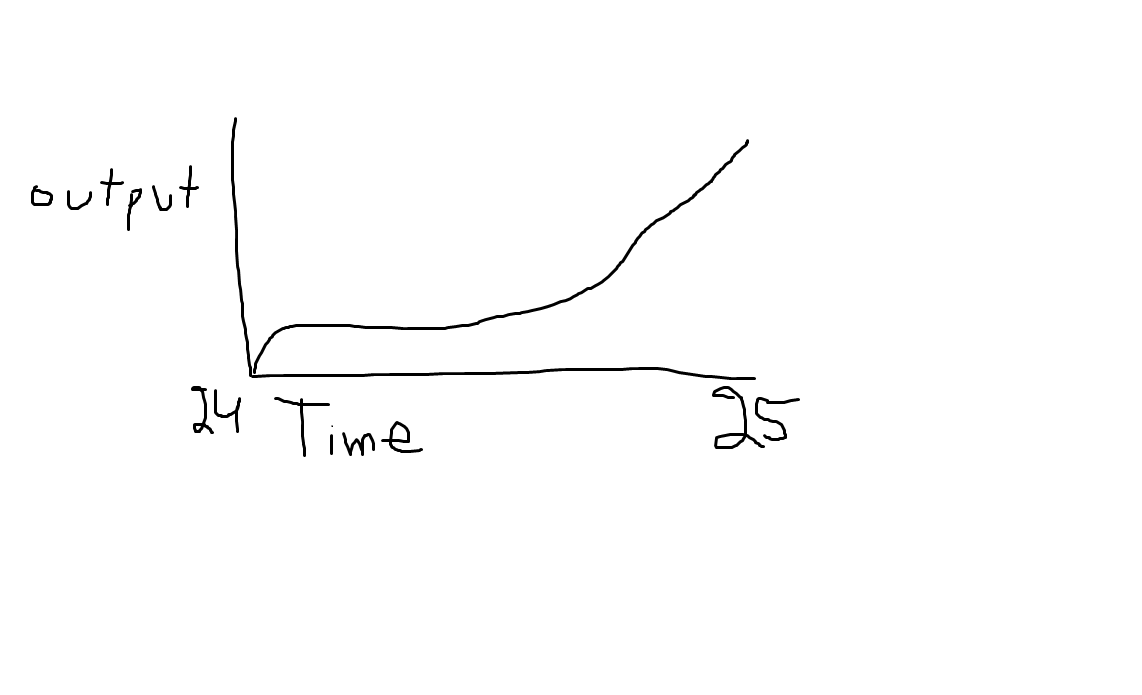
Imagine a graph of a YouTube channel’s growth:
- In 2024, you create the channel → output is low
- In 2025, views/subscribers increase → output goes up
- Time goes forward, and output keeps changing
Vertical axis = output
Horizontal axis = time
This type of continuously changing data is time series data, and a database that stores it is called TSDB.
👉 Prometheus = Time Series Database (TSDB)
👉 It stores metrics with timestamps.
📡 How Metrics Flow in Our Setup
Here is the flow:
cAdvisor → Prometheus → TSDB (Prometheus internal storage)- cAdvisor collects metrics from Docker containers
- Prometheus scrapes/collects those metrics
- Prometheus stores them inside its TSDB
- We can query these metrics using PromQL
Project Link: https://github.com/Raeesqazi/observability-for-devops
⚙️ Prometheus Installation (Docker Compose)
Below is the configuration we use inside docker-compose.yml:
prometheus:
  image: prom/prometheus:latest
  container_name: Prometheus
  ports:
    - 9090:9090
  command:
    - --config.file=/etc/prometheus/prometheus.yml
  volumes:
    - ./prometheus.yml:/etc/prometheus/prometheus.yml:ro
  depends_on:
    - cadvisor
  networks:
    - monitoring
Explanation (Easy Words):
image: prom/prometheus:latest Pull the latest Prometheus image
ports: 9090:9090 Prometheus runs on port 9090
command: --config.file=... Prometheus always needs a config file volumes: Copy our local prometheus.yml into the container
depends_on: cadvisor Start Prometheus only after cAdvisor
networks: Both run on the monitoring network
📄 Understanding prometheus.yml File
This file defines HOW Prometheus will scrape the metrics.
# my global config
global:
  scrape_interval: 15s # Set the scrape interval to every 15 seconds. Default is every 1 minute.
  evaluation_interval: 15s # Evaluate rules every 15 seconds. The default is every 1 minute.
  # scrape_timeout is set to the global default (10s).

# Alertmanager configuration
alerting:
  alertmanagers:
    - static_configs:
        - targets:
          # - alertmanager:9093

# Load rules once and periodically evaluate them according to the global 'evaluation_interval'.
rule_files:
  # - "first_rules.yml"
  # - "second_rules.yml"

# A scrape configuration containing exactly one endpoint to scrape:
# Here it's Prometheus itself.
scrape_configs:
  # The job name is added as a label `job=<job_name>` to any timeseries scraped from this config.
  - job_name: "prometheus"

    # metrics_path defaults to '/metrics'
    # scheme defaults to 'http'.

    static_configs:
      - targets: ["localhost:9090"]
       # The label name is added as a label `label_name=<label_value>` to any timeseries scraped from this config.
        labels:
          app: "prometheus"
Simple Explanation:
🔹 scrape_interval: 15s
Prometheus will collect metrics every 15 seconds.
🔹 scrape_configs:
Here you tell Prometheus which target to scrape.
🔹 targets: ["localhost:9090"]
Prometheus will collect its own metrics.
Later, we will add:
cadvisor:8080So Prometheus can collect container metrics from cAdvisor.
🛠 Practical Work (Commands You Use)
1. Download Default Prometheus Config
wget https://raw.githubusercontent.com/prometheus/prometheus/main/documentation/examples/prometheus.yml2. Edit docker-compose.yml
vim docker-compose.yml(Add Prometheus service as shown earlier)
Save file → :wq
3. Restart Docker Compose
docker compose down
docker compose up -d
You will now see 4 containers running:
- Redis
- Notes-App
- cAdvisor
- Prometheus
Check running containers:
docker ps🌐 Access Prometheus
- Go to AWS EC2 → Security Groups
- Open inbound port 9090
- Enter in browser:
http://<YOUR-EC2-IP>:9090You will see the Prometheus dashboard 🎉.
Prometheus is now live and collecting metrics!
🙏 Final Words
I hope this blog helped you understand Prometheus in a simple and clear way.
In upcoming blogs, we will connect cAdvisor → Prometheus → Grafana to build a complete monitoring dashboard.
Please share and subscribe to support the content!
Stay tuned for the next part.
🌐 Online References
- LinkedIn: https://www.linkedin.com/in/raees-yaqoob-qazi-ryqs/
- Medium Blog: https://medium.com/@raeesyaqubqazi
- Blogspot: https://brillertechnologies.blogspot.com/
- Facebook Page: https://web.facebook.com/profile.php?id=61553548371216
- YouTube Channel: https://www.youtube.com/@RaeesQ.
- TikTok: https://www.tiktok.com/@mrryqs?_t=ZS-8y7t0fQfJKu&_r=1
Comments
Post a Comment