Prometheus and Grafana Project — Part 1 (by Raees Yaqoob Qazi)
Raees Qazi | DevOps Engineer | Learner | Mentor | Creator | CEO-Briller Technologies
Today, I’m starting a new hands-on series about Prometheus and Grafana.
This will be a detailed, practical project divided into 4–5 blogs, where we’ll go step by step from setup to complete monitoring.
🧠 What This Project Is About
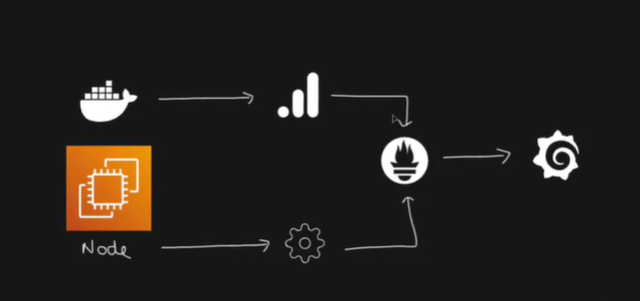
As shown in the project diagram (above), here’s the overall workflow we’ll follow:
- Create an EC2 instance on AWS.
- Install Docker and run it on that instance.
- Deploy a sample application inside a Docker container.
- Use cAdvisor to collect metrics (like CPU, memory, and container stats).
- Forward metrics to Prometheus, which stores and organizes the data.
- Install Node Exporter to collect system-level metrics from the EC2 instance and Forward metrics to Prometheus
- Finally, use Grafana to visualize all these metrics on a beautiful dashboard.
This setup helps us easily monitor:
- How well our app is running,
- The system performance,
- Incoming and outgoing traffic,
- And overall health of the environment.
Although it’s a simple project, I’ll break it down into several parts to make it easy to follow and understand.
⚙️ Practical Work (Part 1)
Step 1: Launch EC2 Instance
- Instance Type:
t2.medium - Volume:
20 GB
Step 2: Update the Machine and Install Docker
Run these commands one by one:
sudo apt-get update -y
sudo apt-get install docker.io -y
sudo apt-get install docker-compose-v2 -y
sudo usermod -aG docker $USER && newgrp docker  # No need to restart after this
docker ps   # To check running containers
Step 3: Set Up the Project Directory
mkdir observability
cd observability
git clone https://github.com/Raeesqazi/node-todo-cicd.git
Step 4: Create docker-compose.yml File
Open the file:
vim docker-compose.ymlAdd the following content:
networks:
  monitoring:
    driver: bridge

services:
  note-todo:
    build:
      context: ./node-todo-cicd
    ports:
      - "8000:8000"
    container_name: note-todo
Save and exit:
:wqNow run the application:
docker compose up -d🔓 Step 5: Allow Port in Security Group
- Go to your EC2 instance’s Security Group settings.
- Allow port 8000 (TCP) from Anywhere (0.0.0.0/0).
🌐 Step 6: Test the Application
Copy your EC2 public IP address, paste it into your browser, and open:
http://<your-ec2-ip>:8000You should now see your Node Todo app running successfully!
That’s it for Part 1.
In the next blog, we’ll move forward with setting up cAdvisor, Node Exporter, and Prometheus to start collecting real-time metrics.

If you found this helpful, please share and subscribe so others can also learn from it.
Stay tuned for Part 2!
🌐 Online References
- LinkedIn: https://www.linkedin.com/in/raees-yaqoob-qazi-ryqs/
- Medium Blog: https://medium.com/@raeesyaqubqazi
- Blogspot: https://brillertechnologies.blogspot.com/
- Facebook Page: https://web.facebook.com/profile.php?id=61553548371216
- YouTube Channel: https://www.youtube.com/@RaeesQ.
- TikTok: https://www.tiktok.com/@mrryqs?_t=ZS-8y7t0fQfJKu&_r=1


Comments
Post a Comment